
Creative Destruction
Why is the 2025 Economics Nobel prize so important?

Long-term growth theory should be far more mainstream than the quarterly GDP print. Politicians and media oversell quarterly economic growth numbers1, which distract from the transformational impact sustained growth can have on living standards.
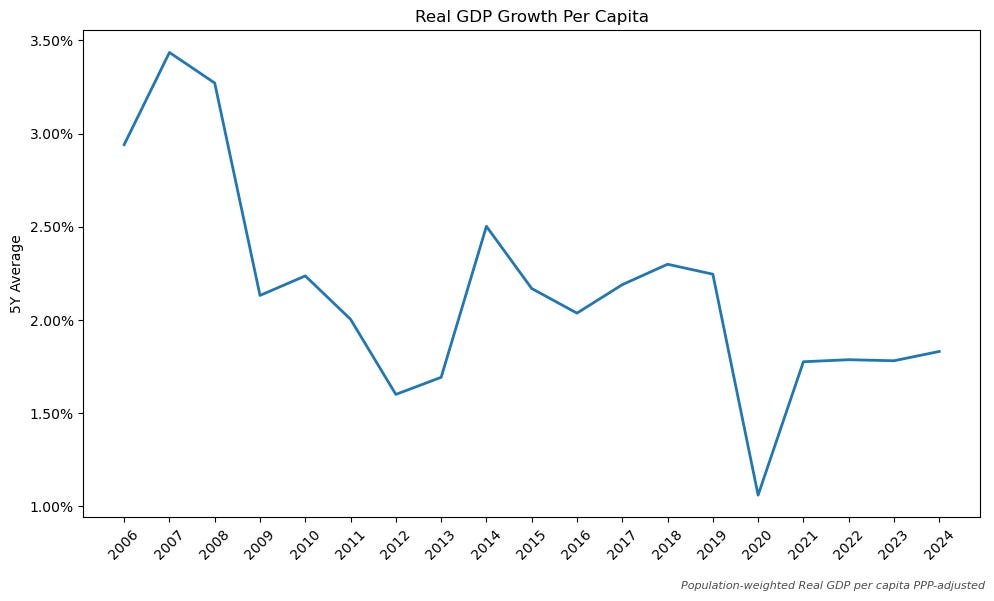
One of the most underappreciated secular trends this century has been the global slowdown in growth (Fig 1). This matters because 85% of the world’s population is still poor, and small differences compound into massive divergences. South Korea and India had similar incomes in 1960. Korea then grew just 2% faster annually. Today, Korean living standards are nearly 5x higher!
Before explaining how the Nobel fits in, it’s important to understand this simple equation in relation to economic growth:
Y = Economic output (GDP)
A = Productivity aka Total Factor Productivity
K = Capital (machinery, buildings, equipment, etc.)
L = Labour (workers, hours worked)
This equation states that for a given level of productivity (A) economic output (Y) is a function of the capital (K) and labour (L) in the economy. Capital and labour have diminishing returns; for example, adding a 10th tractor or 100th employee helps less than adding the first one. So, over the long term, the most important factor is productivity, which depends on technological progress in society. For example, I can produce more crops with a tractor than with a sickle.
Of these 3 factors, the step change decrease in productivity growth has by far been the biggest contributor to the global slowdown (Fig 2).
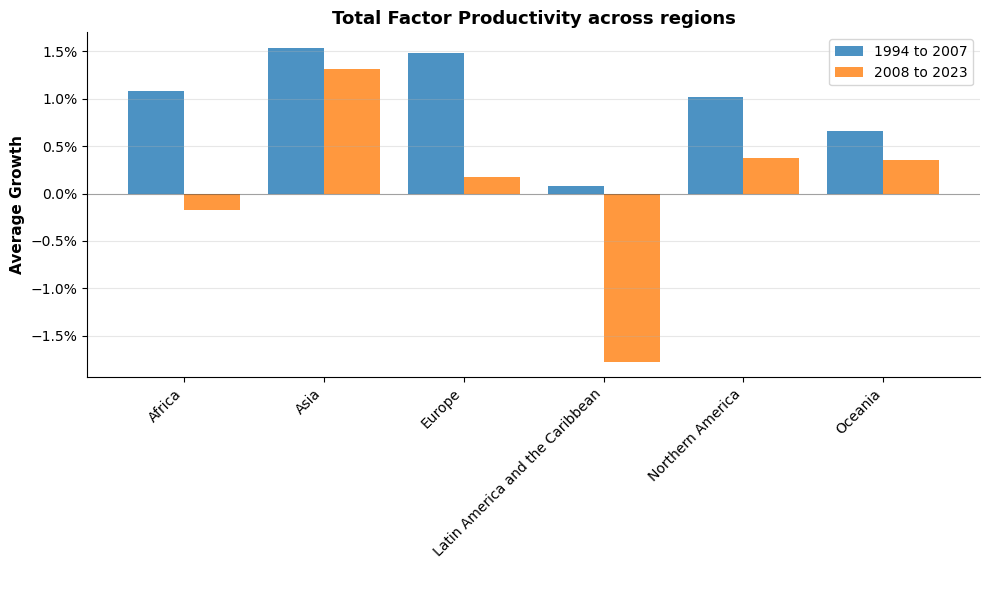
Outside Asia, productivity growth has halved or worse, indicating a meaningful decline in the rate of technological progress. Tyler Cowen coined the term “The Great Stagnation” for this phenomenon in 2011.
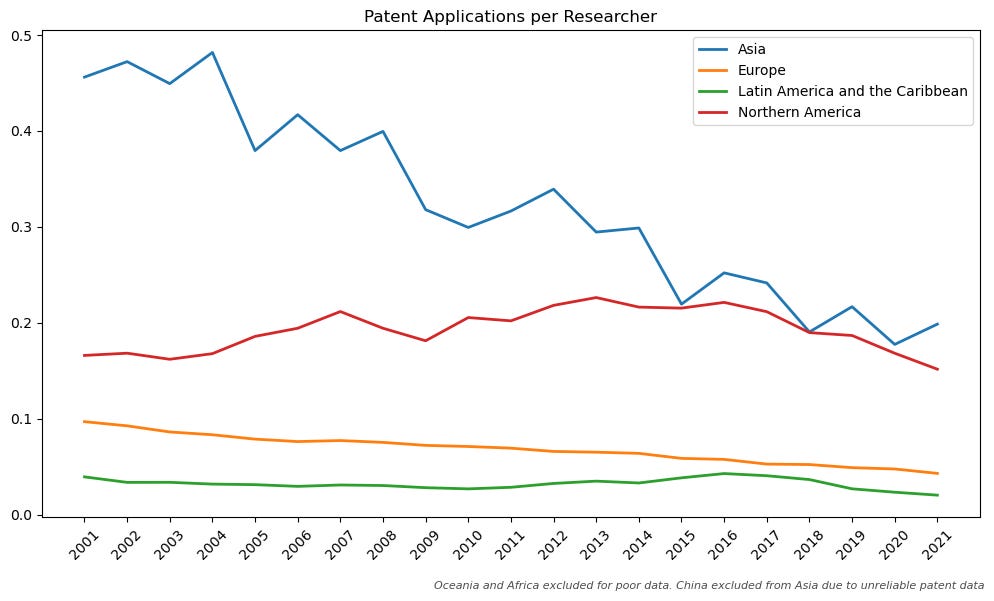
The evidence goes deeper than aggregate productivity. Research productivity itself has collapsed (Fig 3). Patent applications per researcher have fallen by half globally, with particularly sharp declines in advanced economies.
So what’s driving this innovation collapse? And more importantly, can we reverse it? This is exactly what the 2025 Economic Prize addresses. Philippe Aghion and Peter Howitt won for their work on ‘Creative Destruction’2, the process they identified as the fundamental driver of innovation in society. Through both theoretical and empirical analysis, they demonstrated that this mechanism of creative destruction determines the rate and impact of innovation, which in turn drives economic growth through productivity growth.
Aghion and Howitt argue that in many industries, a select few firms (incumbents/frontier) earn monopoly rents—profits much above the cost of producing those goods and services. Motivated by the prospect of earning monopoly rents, new and existing firms spend on R&D and innovate to disrupt these incumbents and capture their market share; they play ‘catch-up’ with the frontier firms. As these incumbents come under threat, they also engage in R&D and innovation to protect their monopoly rents and outcompete the challengers; they try to ‘escape competition’.
Regardless of who wins this constant tug of war, innovation happens. And innovation has strong positive externalities; once there’s a technological breakthrough in an industry, it eventually becomes the norm and raises productivity for everyone. It raises A in society!
Using that intuition, they aggregated this dynamic from the micro level (individual industries) to the macro level (the entire economy). Economic growth emerges through the following process:
g = economic growth
λ = frequency of innovation
γ = size/impact of innovation
Economic growth depends on two factors: how often innovations occur (λ) and how impactful each innovation is (γ). While the impact of any single breakthrough is inherently unpredictable3, the frequency of innovation can be influenced, and Aghion and Howitt showed it’s driven by competitive intensity.
They tested this empirically, measuring innovation through citation-weighted patents and competition through market markups4 (where lower markups indicate more intense competition). The data revealed two distinct patterns: a linear relationship in some industries and an inverted U-curve in others.5
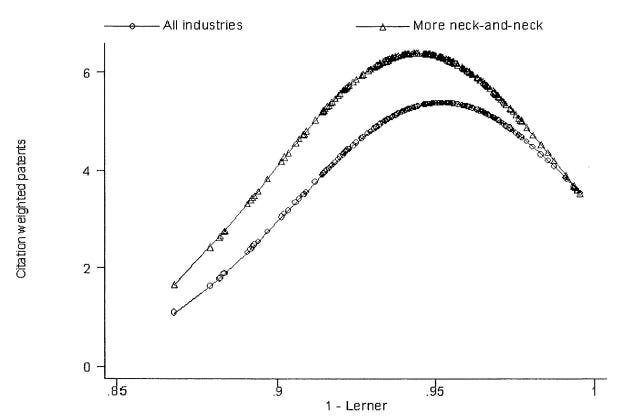
Initially, both the linear and U-curve models predict that, as competition increases, there is an increase in innovation due to the ‘escape competition’ and ‘catch-up’ dynamic in place. However, the U-curve model reveals a critical threshold: beyond a certain point, competition becomes destructive to innovation.
When markets are hyper-competitive, firms can’t earn enough economic profit to justify incremental R&D investment. Innovations get copied immediately, prices get competed down to cost, and the incentive to innovate vanishes. This is the downward slope of the U-curve.
The relationship depends on market structure. In “neck-and-neck” industries where firms are evenly matched, innovation is far more sensitive to competitive pressure—both the benefits of moderate competition and the risks of excessive competition are amplified.
This raises the question: where are we on the U-curve today? Aghion and Howitt argue that for most industries, we remain on the upward-sloping portion of the curve, where increased competition would stimulate innovation rather than hamper it. The key evidence: markups are elevated and rising, indicating competitive intensity remains below optimal levels. Their analysis draws on research measuring Global Market Power at the firm level (Fig 5).
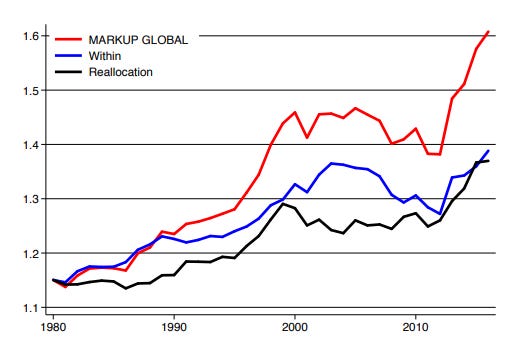
Markups have increased substantially over the past four decades, rising from approximately 1.15x to over 1.60x the cost! This rise reflects two components: firms increasing their own markups (within) and high-markup firms gaining market share (reallocation). Recently, the reallocation effect has become increasingly prominent, indicating that economic activity is concentrating among high-markup incumbents.
Curious to replicate this, I used EU KLEMS (includes EU, Japan and the US) industry-level dataset to measure and analyse markups from 2002 to 20196. Note that the magnitude of markups will appear more muted in comparison, as the reallocation dynamic won’t be captured in industry-level analysis, which averages across all firms within a sector.
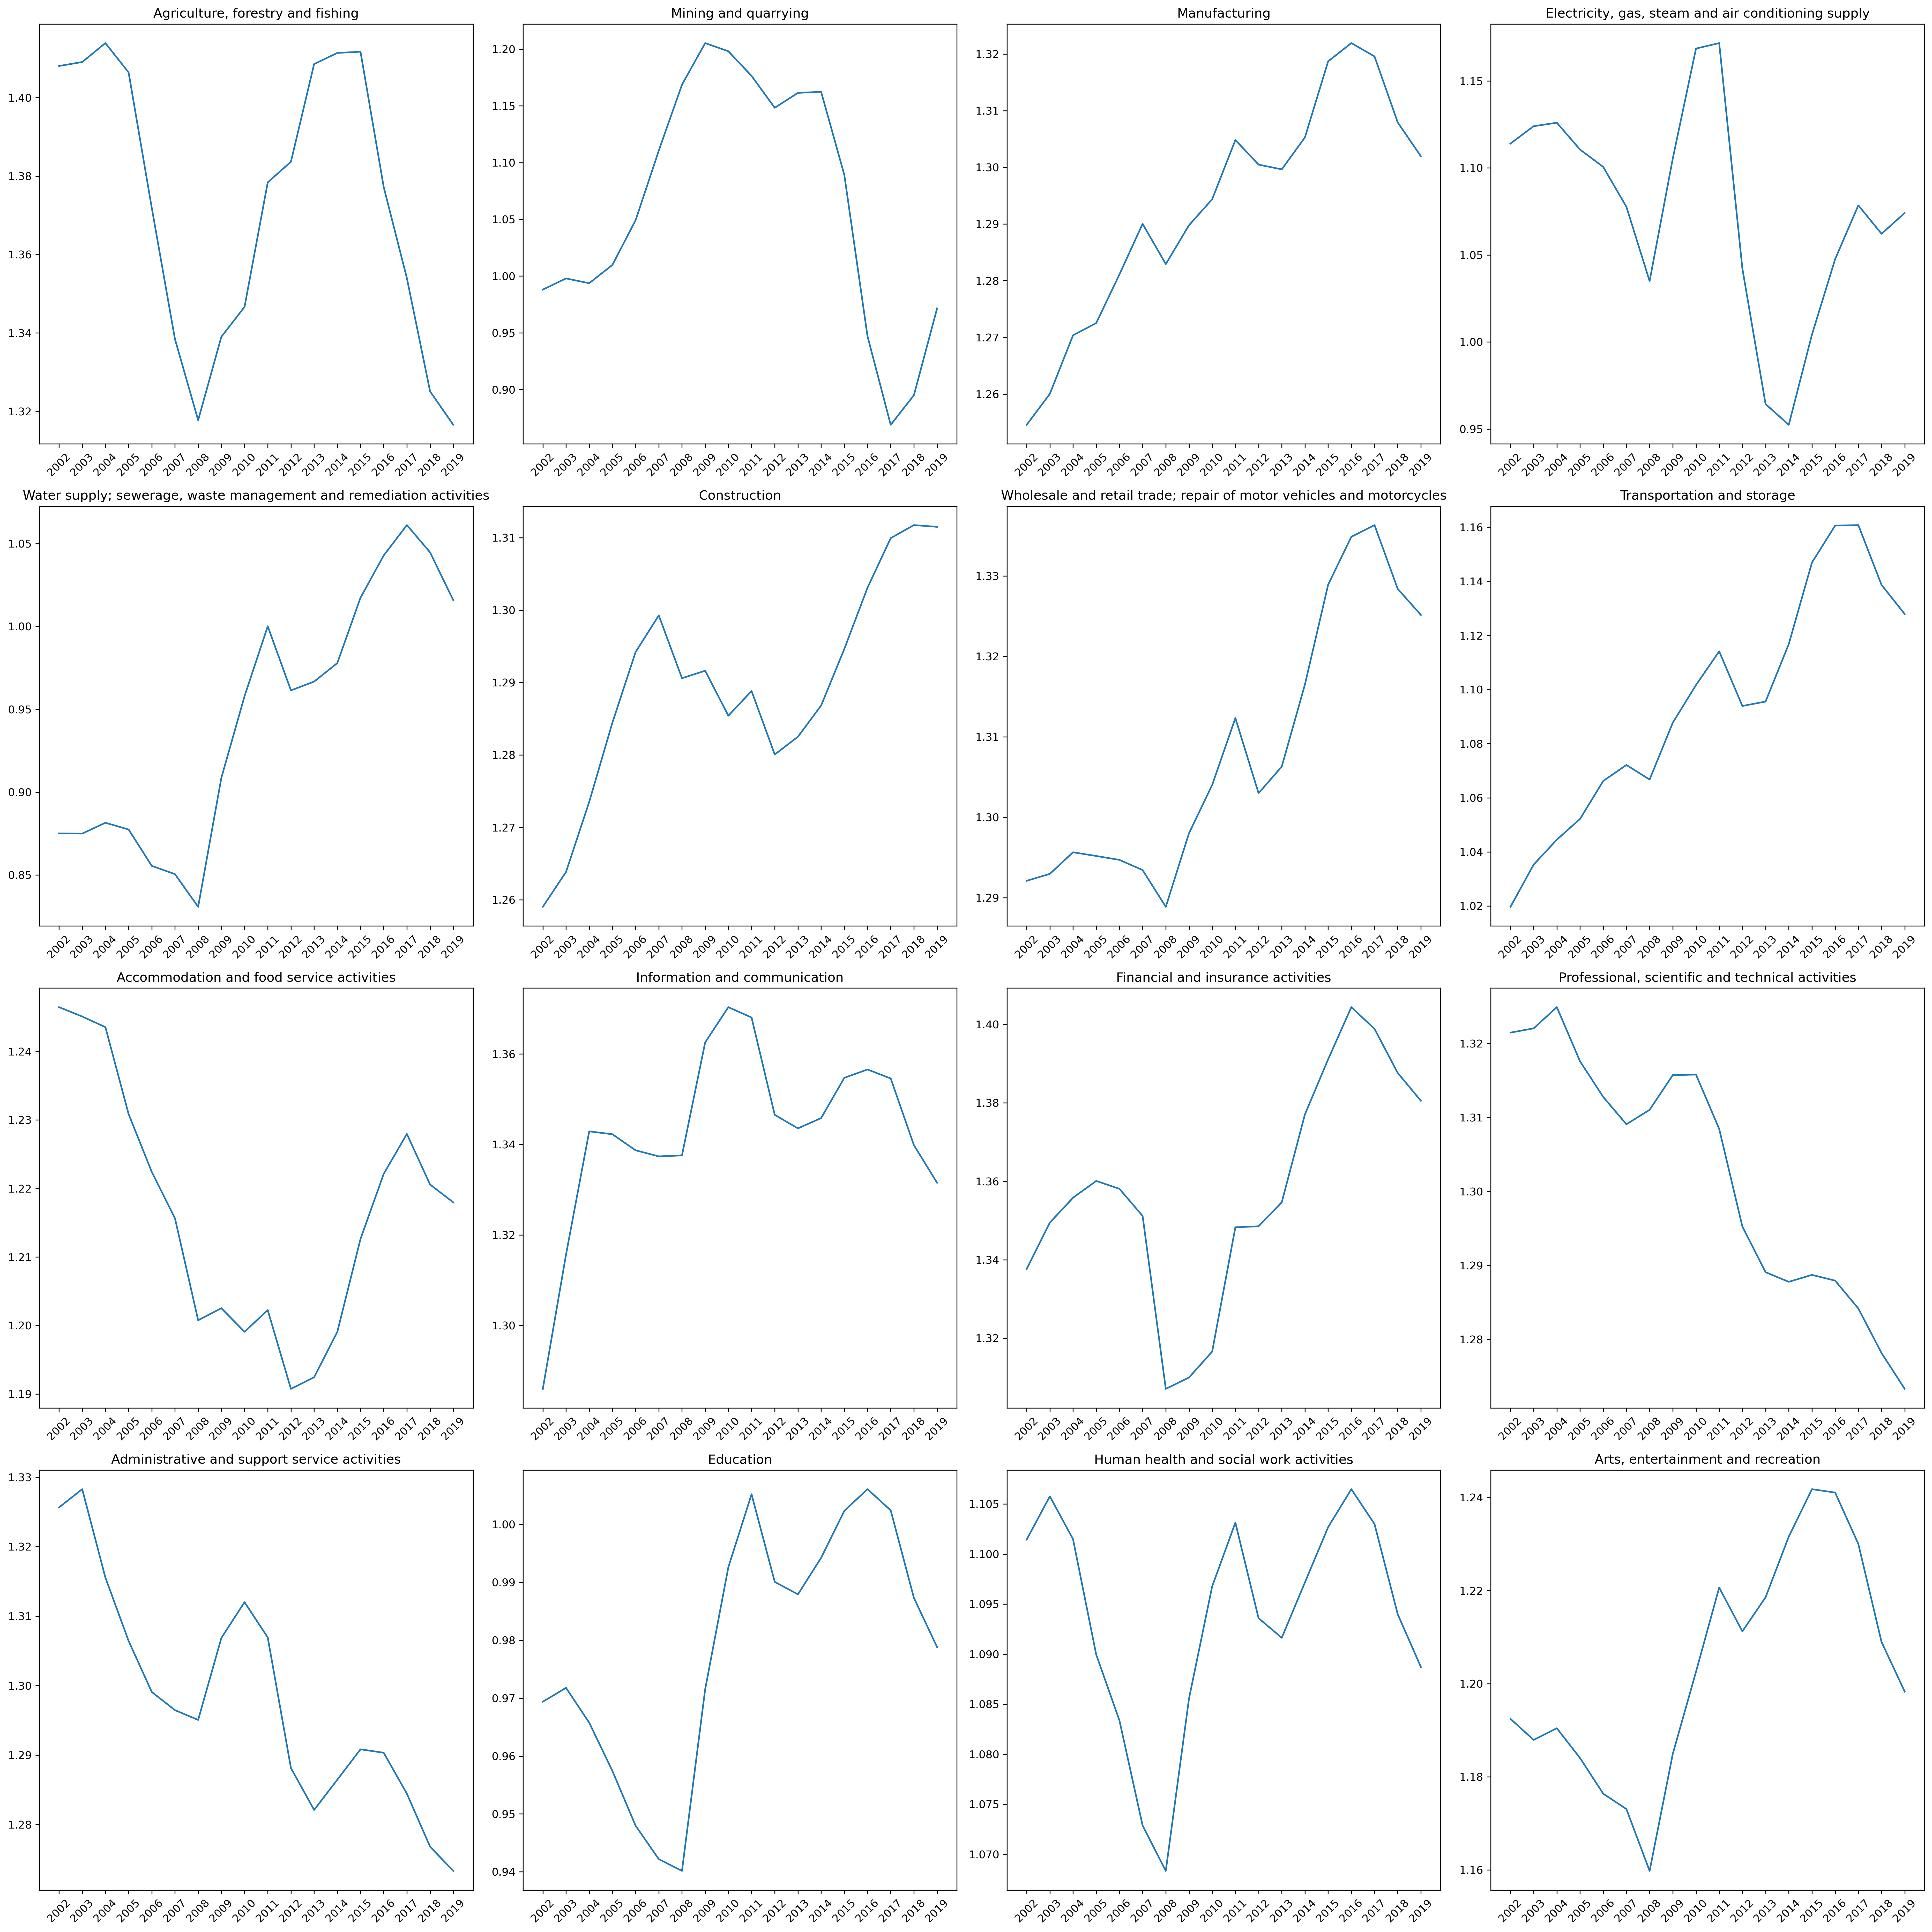
The results show meaningful heterogeneity across sectors. IT, Finance and manufacturing saw steady increases in markups, while agriculture and administrative services showed declines. This variation reflects different competitive dynamics across industries. That said, the aggregate pattern broadly confirms their claim. Three-quarters of industries showed either increases or stability in markups, with only a quarter declining. This suggests that, on balance, competitive intensity has weakened rather than intensified across developed economies.
So why is competition decreasing? Aren’t free markets supposed to self-correct? The answer lies in a self-reinforcing cycle that prevents market correction:
Concentration → Arrow Replacement Effect → Regulatory Capture → Concentration
Let me explain.
Winner-takes-all dynamics now dominate many industries globally, where big incumbents have close to monopoly market concentration. The ‘Mag 7’ represents ~35% of the US equity market cap, the Top 5 ‘Chaebols’7 in South Korea represent more than half of the country’s corporate revenue, and the ‘Big Four’ banks in Australia have close to ~75% market share.
This is an issue because when you are that dominant, you witness the Arrow Replacement Effect: Monopolist gains less from innovation than a competitive firm would. Why? Because when the gap versus the other firms is so wide, and there are no credible threats, the incentive shifts from innovation to optimisation and protection of existing profits. Ex: Pre-ChatGPT, Google’s search experience became increasingly worse with more and more ads.
The most harmful way this ‘optimisation and protection’ manifests is through Regulatory Capture. It’s as 1982 Nobel Winner George Stigler said:
In regulatory capture a special interest is prioritized over the general interest of the public leading to a net loss for society.
These dominant firms use lobbying, the revolving door of executives between industry and regulation, and other mechanisms to serve their special interests. This raises barriers to entry and operating costs for new and existing firms, making it nearly impossible for challengers to scale, which further entrenches the concentration that started the cycle. Bill Gurley has done an awesome job explaining this here.
Apart from anecdotal examples, you actually see evidence of this in qualitative metrics such as the State Capture Index.8 SCI proxies the extent to which powerful actors, private or state shape a country’s laws, policies, and institutions for their own benefit rather than the public good.
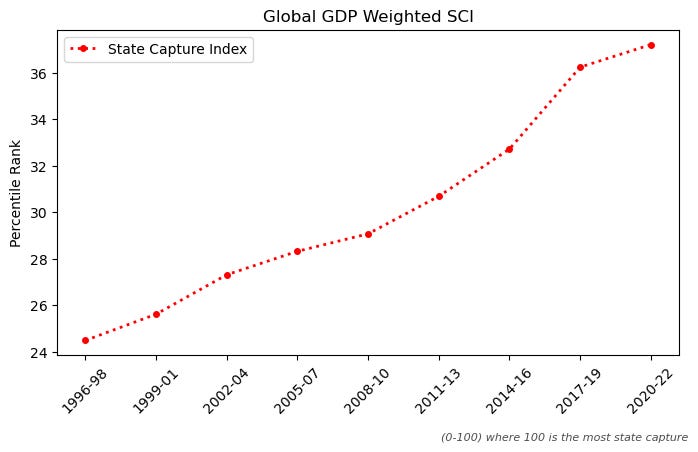
Bigger economies have seen a significant increase in state capture relative to others in the last 3 decades (Fig 7). This is indicative of the concerning self-reinforcing cycle shaping global economies today.
So what does this cycle cost us?
The growth slowdown from ~3.4% to 1.7% isn’t just a statistic. Compounded over decades, it’s the difference between South Korea and India, between prosperity and poverty for millions.
Aghion and Howitt’s framework shows the problem is solvable. The inverted U-curve reveals that optimal competition exists. Enough pressure to drive innovation, but not so much that firms can’t capture returns. Rising markups indicate most industries need more competitive intensity, not less.
The solution isn’t simplistic “break up big companies” antitrust, it’s understanding the competitive dynamic in each industry and calibrating policy accordingly. But the state capture data reveals the fundamental obstacle: concentrated economic power becomes political power, which firms then use to prevent the very competition policies that would challenge them.
I don’t have the answer to breaking that cycle. But at least now we have a framework to understand what would need to change…
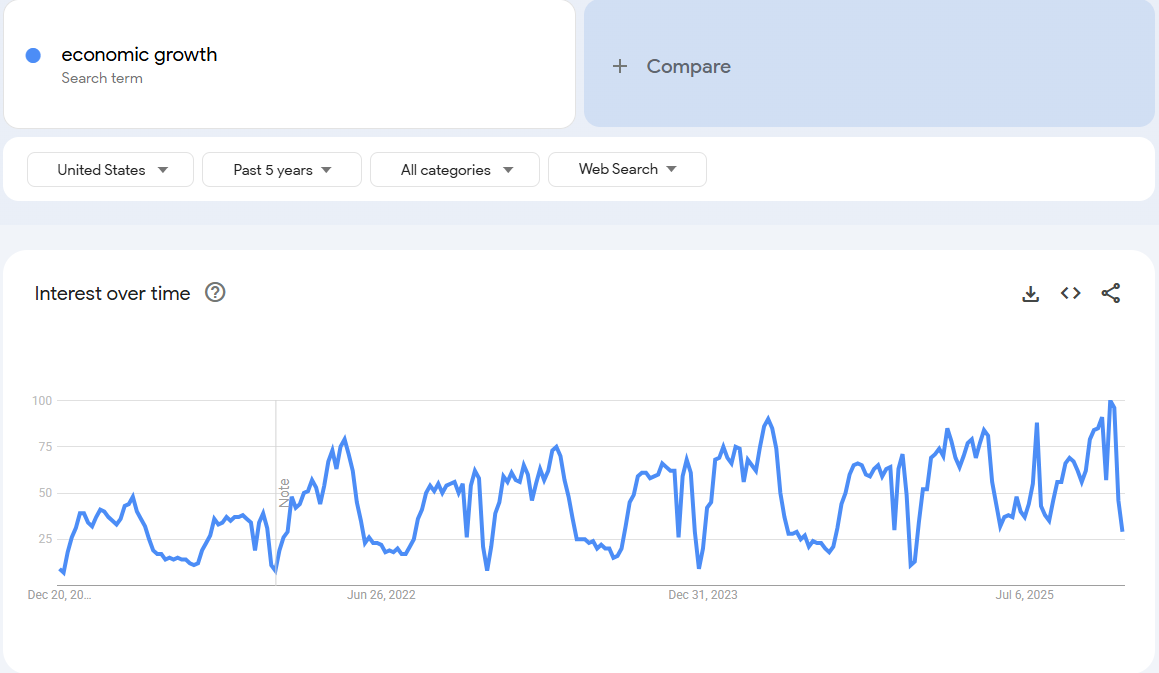
From Google search trends, you can see economic growth interest spikes each quarter.
‘Creative destruction’ was first coined by Joseph Schumpeter in 1942.
The fundamental impulse that sets and keeps the capitalist engine in motion comes from the new consumers’ goods, the new methods of production or transportation, the new markets, . . . [This process] incessantly revolutionizes the economic structure from within, incessantly destroying the old one, incessantly creating a new one. This process of Creative Destruction is the essential fact about capitalism.
A case in point would be LLMs. Google released the paper ‘Attention is all you need’ in 2017. It was the foundational paper that researchers at OpenAI used to build the transformer architecture that powers LLMs today, and is ironically threatening Google’s search business today.
Markup is essentially a measure of how much above their costs a company sells its goods and services for, where a large markup indicates lower competition.
Chart and relationship from Aghion, Bloom, Blundell, Griffith and Howitt (2005).
Dataset only available till 2021, hence avoiding the COVID-impacted years.
Chaebols are massive family-controlled conglomerates in South Korea (Samsung, LG, Hyundai, etc.).
The ingenuity of this measure is that it does not treat laws as fair game. For example, it captures that US lobbying is a form of state capture, even if it is technically legal
Solid explanation of the framework that gives a deep understanding of our economic slowdown. Of course, there are a lot of other market forces at play here in the global economic slowdown.
My random non-data-backed rant...
I had my suspicions that more competition should improve the rate of innovation, but glad to read this well-written article and learn how the data supports my theory too!
It is a difficult cycle to break out of. I have studied India, Canada and the US the most so I can share my observations on them.
India has a highly competitive landscape, but I feel it risks falling back because of how dominant the large conglomerates are becoming. The influence these large corporations have on the macro-environment seems to weigh down the country's potential growth rate. That said, India has immense potential and I hope to see it realized in the coming 10 years.
On a the other side we have the US. It has long been the land of opportunity, driven by intense market competition. While a few giants definitely dominate specific industries, the US ecosystem generally maintains a dynamic balance that forces companies to innovate or die—something that is vital for sustained growth.
Finally, Canada is a prime example of a country that arguably needs more competition. The economy is heavily reliant on large incumbents—especially in telecom, banking, and groceries—that sit comfortably on fat profit margins. This lack of competitive pressure correlates with Canada having one of the slowest per-capita growth rates among developed nations. I believe introducing more competition could really unlock the country's potential, especially given its strong cultural foundations.
I also like that we have some healthy competition between countries themselves, which pushes the governments to keep their companies in check and on their toes to keep competing with the world. However, we are right now in the phase where we are defining the leaders in this economic war of countries that US and China seemed to be leading. Will be interesting to see how things go about in a few years.
Looking forward to your next article!